Executive Summary执行摘要
The user's thesis — that the AI capex supercycle will produce low returns on investment because of (i) an unbridgeable scale-versus-revenue gap, (ii) rapid GPU depreciation, (iii) upstream overbuild under optimistic expectations, and (iv) collapsing token prices — is directionally validated but over-stated in its strong form. Our assessment, after checking each pillar against the data available as of September 2026:
| Pillar | Verdict | Confidence |
|---|---|---|
| (i) Trillion-scale capex requires revenue that will take years to materialize | Validated on the arithmetic; timing risk cuts both ways — the revenue inflection is happening faster than bears expected, but not fast enough to justify the full build by 2030 on any base-case path | High |
| (ii) GPUs depreciate far faster than fiber/subsea cable | Partially validated — true for frontier-training economics (1–3 years), but the "value cascade" into inference, the power bottleneck, and the 2026 H100 rental rebound complicate the "fast e-waste" claim; the real exposure is accounting (roughly $176B of potentially overstated hyperscaler earnings 2026–28) rather than literal obsolescence | Medium-high |
| (iii) Upstream overbuild under bullish expectations | Validated as a mechanism, gated by physics — capex guidance has been revised up ~158% versus two-year-old estimates, financing has shifted from cash flow to debt and equity, and the marginal capacity is being built by the weakest balance sheets (neoclouds, Oracle). But power — not chips — is the binding constraint, which paradoxically limits usable overcapacity | Medium-high |
| (iv) Token price deflation undermines ROI | Validated for the model layer, incomplete for the compute layer — commodity-tier prices have fallen ~150x since 2021, but demand elasticity is above 1 (Jevons), frontier pricing holds, and token volumes are growing ~7x/year at Google. Deflation transfers surplus to the application layer; it does not automatically destroy compute demand | Medium |
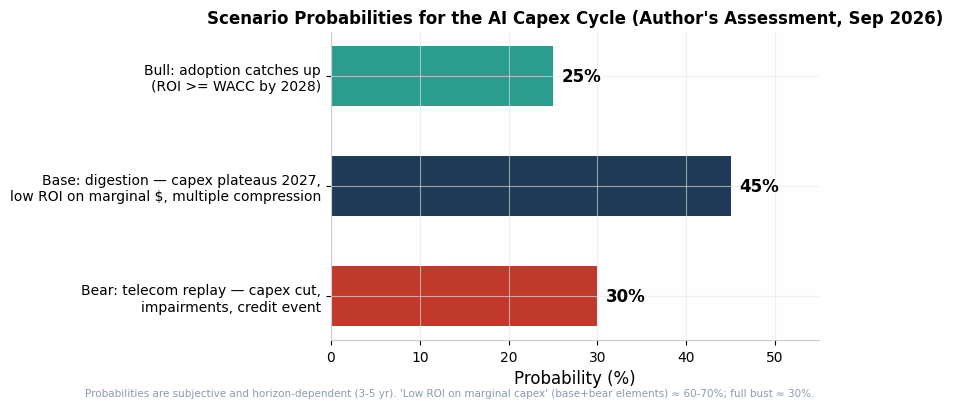
Probability-weighted scenario conclusion (3–5 year horizon): Bull (revenue catches up, capex earns its cost of capital) ~25%; Base (digestion — capex plateaus in 2027, low single-digit ROIC on the marginal dollar, multiple compression without systemic bust) ~45%; Bear (telecom replay — capex cut, impairments, credit event in the neocloud/lab complex) ~30%. The user's core claim — "low ROI on the marginal capex dollar" — carries roughly a 65–70% probability when base and bear are combined; the stronger claim of an outright investment bust carries roughly 30%, but that tail is now being priced in credit markets (CoreWeave CDS ~700bp, Oracle at ~200bp and downgraded to BBB-) in a way it was not twelve months ago.
The single most important nuance for positioning: the losses will not be evenly distributed. The depreciation and overbuild risk concentrates in the GPU-collateralized, levered, single-theme balance sheets (neoclouds, Oracle's OpenAI book, private lab credit), while the token-deflation risk concentrates in foundation-model economics. The hyperscalers face an ROIC-dilution problem, not a solvency problem. The investment implication is therefore not "short AI" but steepen the barbell: own the monetizers and the power-constrained picks-and-shovels with contracted backlog; underweight or short the entities that hold the depreciation schedule on borrowed money.
1. The Scale of the Bet: Capex Has Gone Parabolic, and the Funding Model Has Changed1. 豪赌的规模:资本开支呈抛物线式增长,融资模式已然转变
Any validation exercise has to start with the numbers, because the user's first premise — "nearly trillion scale" — is now actually conservative. The four largest hyperscalers (Amazon, Microsoft, Alphabet, Meta) are guiding to roughly $725–732 billion of combined capex in 2026, up ~77–79% from ~$410 billion in 2025, with Amazon at ~$200B, Microsoft tracking toward ~$190B, Alphabet at $175–205B after raising its ceiling at Q2 2026 earnings, and Meta at $125–145B after two upward revisions (Yahoo Finance/Goldman, Statista, ValueAdd VC tracker). Including Oracle (~$50B), the five-issuer complex approaches $690–800B, and Goldman Sachs' broader "augmented" measure puts global AI investment at roughly $1 trillion in 2026 — just under $600B in the US alone, ~1.8% of US GDP, rising to a modeled 2.8% by 2028 (Goldman Sachs). Goldman's baseline supply-side model implies $765B of AI capex in 2026 growing to ~$1.64 trillion by 2031, a cumulative ~$7.6 trillion across compute, data centers, and power (Goldman Sachs); Morgan Stanley's bottom-up numbers are in the same zip code at ~$805B for 2026 and ~$1.1 trillion for 2027 (Morgan Stanley via Threads).
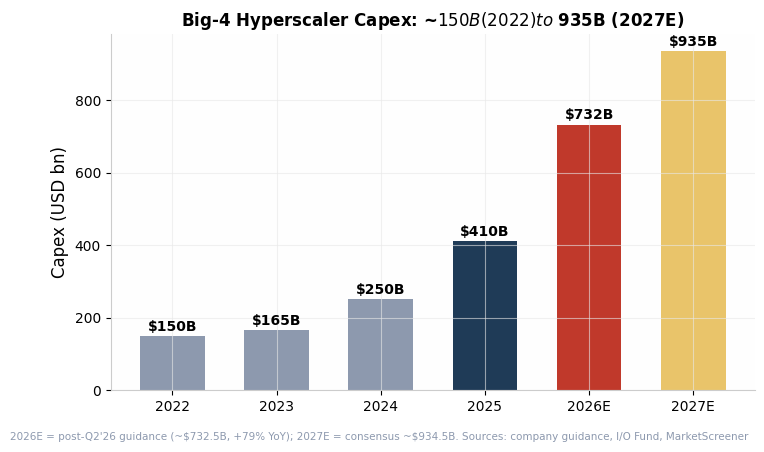
The more consequential development in 2026 is not the level but the funding regime change. The first phase of this cycle (2023–25) was funded almost entirely out of operating cash flow — the strongest possible financing base. That phase is over. Alphabet printed its first negative free-cash-flow quarter (-$5.9B) since the 2004 IPO in Q2 2026 and raised $84.75B of equity in June 2026 — the largest equity capital raise by a listed corporate ever — alongside a $20B bond program that included a 100-year sterling issue (Forbes/Shefrin, FactSet). Amazon's Q1 2026 FCF collapsed to $1.2B from $25.9B a year earlier, with full-year 2026 estimates from Morgan Stanley/BofA at negative $17–28B (Forbes/Shefrin, Introl). Hyperscaler IG bond issuance ran $108B in 2025, $194B in H1 2026 alone, and Goldman expects ~$250B for full-year 2026 (33% of capex) rising to ~$400B (35%) in 2027 (Goldman Sachs, Yahoo Finance). On top of reported capex sits an off-balance-sheet iceberg: the WSJ counts ~$3 trillion of off-balance-sheet AI commitments across nine tech companies, and J.P. Morgan tallies ~$1.4T of disclosed data-center lease obligations (~$1.1T not yet on balance sheet) plus ~$1.5T of unconditional purchase commitments for chips and power (WSJ via Conard roundup, J.P. Morgan AM).
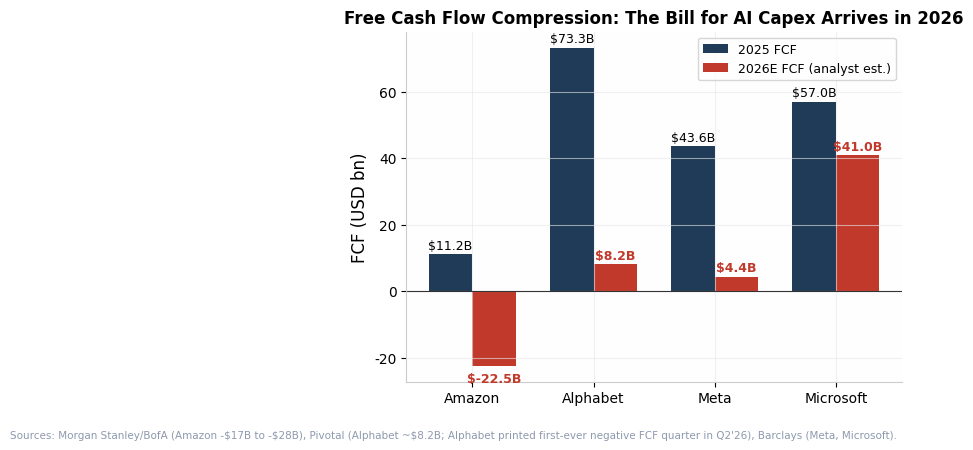
Why this matters for the ROI question: when capex is funded from operating cash flow, a bad outcome is dilutive returns and a multiple de-rating. When capex is funded by debt, equity issuance, SPVs, and vendor financing, a bad outcome acquires a credit transmission channel — covenants, refinancing walls, collateral revaluation — that converts a slow ROIC disappointment into a discrete liquidity event. The BIS said exactly this in its 2026 annual report: "Disappointment in returns could trigger a sudden pullback in financing and turn the capex boom into a protracted investment bust, with potential knock-on effects on financial conditions" (BIS via Fortune). This is the mechanism that takes the user's thesis from "low returns" to "nonlinear loss," and it is materially more developed in September 2026 than it was a year ago.
2. Pillar-by-Pillar Validation2. 逐支柱验证
2.1 Pillar (i): The Scale-Versus-Revenue Gap2.1 支柱(一):规模与收入之间的缺口
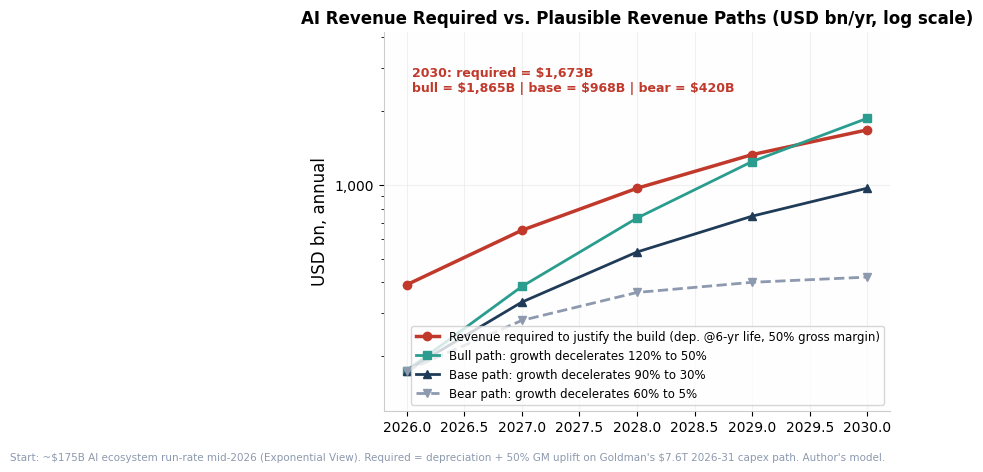
The arithmetic underlying the user's first pillar is sound, and the industry's own scorekeepers keep raising the bar. Sequoia's David Cahn has updated his framework annually: from "AI's $200B question" (September 2023) to $600B (June 2024), $840B (June 2025), and — in July 2026 — "AI's $1.5T question," implying the industry needs roughly $3 trillion of annual revenue to justify the 2026 infrastructure spend, against Anthropic at a rumored ~$60B ARR and OpenAI at a ~$20B annualized run rate when he wrote (David Cahn, AI Weekly/TechCrunch). Bain & Company's independent version of the same calculation says the build requires ~$2 trillion of annual AI revenue by 2030, leaving an ~$800B shortfall against current trajectories (Columbia/circular financing summary, Investing.com/Sparkline). Cahn's methodology — 2x Nvidia's data-center revenue for total system cost, then 2x again for a 50% end-user gross margin — is crude but directionally consistent with our own depreciation-based model.
Our model: anchoring to Goldman's ~$7.6T cumulative 2026–31 capex path, with compute at ~55% of spend depreciated over six years and infrastructure over twelve, the annual depreciation load alone reaches roughly $200B in 2026, ~$485B in 2028, and ~$840B by 2030. Applying a 50% gross margin to cover depreciation and generate any operating return, required ecosystem revenue reaches ~$1.7 trillion by 2030 — consistent with Bain's $2T estimate. Measured against a mid-2026 AI-ecosystem revenue run rate of roughly $175B annualized (Azeem Azhar's de-double-counted estimate; ~$110B recognized over the trailing twelve months) (Conard/Azhar summary), the implied requirement is an ~84% revenue CAGR sustained for four years. Even a genuinely bullish path — growth decelerating 120% → 90% → 70% → 50% — only reaches ~$1.87T by 2030, roughly clearing the bar at the end of the decade; our base path (90% → 30%) lands at ~$970B, barely half of what is needed. In other words: the build-out only pencils if the industry sustains something close to the fastest large-scale revenue ramp in history for another four years. The user's premise (i) is validated on any reasonable base case.
Where the bear case overreaches is in assuming the demand side is static. The counter-evidence is now substantial and accelerating. Microsoft's AI business crossed a $37B annual run rate, +123% y/y, with Azure growing 43% in fiscal Q4 2026 and surpassing $100B in annual revenue; commercial RPO stood at $625B, up 110% y/y, albeit with ~45% of it OpenAI-linked (Microsoft, GeekWire, Futurum). Anthropic's run rate went from $1B (December 2024) to $9B (end-2025) to ~$30B (April 2026) to ~$65B (July 2026) — with its first quarter of positive adjusted operating income in Q2 2026 (SaaStr, SQ Magazine, ValueAdd VC). OpenAI broke out of a five-month plateau to reach ~$40B annualized by August 2026, with enterprise revenue exceeding consumer for the first time — though against audited 2025 financials showing a $20.9B operating loss on $13.07B of booked revenue (ValueAdd VC). And a real milestone passed quietly in Q1 2026: hyperscaler and neocloud AI revenue of ~$25B crossed above the ~$21B depreciation line for the first time — revenue now covers the depreciation of the assets generating it, though not yet a full return on the capital base (Cresset).
The honest reading of pillar (i): the user's direction is right — the gap is real, wide, and still widening in dollar terms (Allianz pegs the capex-versus-revenue divergence at ~46%, worse than the 32% seen in the 2001 telecom cycle) (Forbes) — but the claim that demand "will take a long time" is now contested by the fastest revenue ramp ever recorded in B2B software. The residual risk is concentration and quality of that revenue: a large share of it is frontier-lab API spend funded by venture capital, and ~45% of Microsoft's backlog is one customer's commitments. The adoption data reinforce the caution: McKinsey finds 88% of organizations use AI somewhere but only 39% report any EBIT impact and ~6% qualify as high performers; MIT NANDA found 95% of enterprise GenAI pilots produced zero measurable P&L impact, with 42% of companies abandoning most AI projects in 2025; BCG and KPMG independently put measurable at-scale ROI at 5–8% of enterprises against average budgets of $186M; and PwC's CEO survey found 56% of CEOs saw neither revenue gain nor cost reduction from AI in the prior year (McKinsey via aibusinessweekly, Fortune/MIT, ValueAdd VC, PwC via Master of Code). The reconciliation: AI revenue is real and exploding at the supplier layer (labs, coding tools, cloud AI services), while end-customer P&L impact lags — precisely the configuration Goldman's Jim Covello flagged again in May 2026: "companies are losing more money today implementing this technology than they were two years ago" (Goldman Sachs). Sløk's framing at Apollo is the sharpest version: silicon-layer margins run at ~41% while the model/application layer runs at ~-59% — "the AI boom's profits are currently being funded by investors rather than earned from customers" (Fortune/Apollo).
2.2 Pillar (ii): GPU Depreciation — Faster Than Fiber, But Not E-Waste2.2 支柱(二):GPU 折旧——比光纤快,但不是电子垃圾
The user's depreciation point is the strongest of the four pillars as an accounting claim and the most contestable as an economic claim. On accounting, the evidence is unambiguous that useful life is being managed. The Big Three migrated server depreciation from 3–4 years to a uniform ~6 years between 2020 and 2024 (theCUBE); in January 2025, Amazon shortened a subset of AI-heavy server lives from six to five years — explicitly citing "the increased pace of technology development, particularly in the area of artificial intelligence" and taking a ~$1.3B operating-income hit in 2025 — while Meta extended its server lives to 5.5 years, booking a $2.9B depreciation reduction in the opposite direction on the same silicon (Deep Quarry, All on the Line). Michael Burry's November 2025 salvo quantified the exposure: depreciating 2–3-year-cycle silicon over 5–6 years understates industry depreciation by ~$176B across 2026–28, overstating 2028 earnings by ~27% at Oracle and ~21% at Meta, in his estimate (Burry on X, Dave Friedman). Princeton CITP research supports the engineering case for 1–3-year economic lives at 60–70% utilization for frontier training (Truthbit).
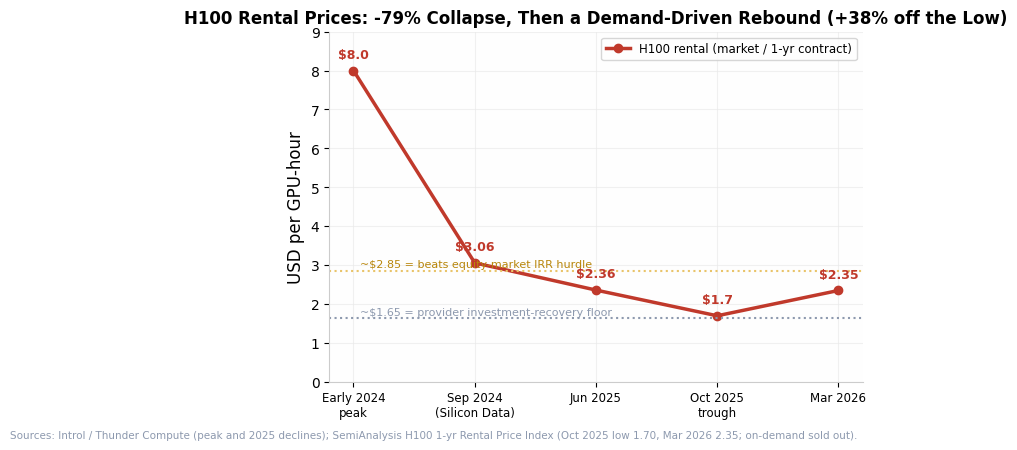
The economic rebuttal — the "value cascade" — is not nothing. Training silicon cascades into premium inference, then batch inference; CoreWeave reports 2020-vintage A100s fully booked and H100s re-leasing at ~95% of original rates; and the constraint on compute in 2026 is power, not silicon — Nadella has acknowledged GPUs sitting idle for lack of electricity (Thunder Said via YouTube summary, Introl). The market data cut the same way and surprised the bears: after collapsing from ~$8/GPU-hour at the 2024 peak to $1.70 in October 2025 (a ~79% decline, through the ~$1.65 provider breakeven floor), SemiAnalysis's H100 one-year rental index rebounded ~40% to $2.35 by March 2026, with on-demand capacity effectively sold out (SemiAnalysis, Introl). This is the single most important falsifiable test of the "fast depreciation = stranded asset" thesis, and so far it has failed to confirm it: old silicon retains value as long as new capacity is power-gated and demand outpaces energized supply.
The subsea-cable analogy in the user's prompt deserves correction in both directions. The user is right that GPUs are not fiber: fiber laid in 1999 was still commercially useful two decades later, while a 2026 GPU faces a successor that is 2–3x more efficient per watt within 12–18 months (Nvidia's annual cadence; Rubin promises ~10x lower inference cost per token than Blackwell) (NVIDIA). But the analogy is incomplete in a way that partially defuses the overbuild risk: dark fiber sat idle because it cost almost nothing to leave unlit and demand was the constraint; GPU capacity is power-gated, and with grid interconnection queues of 4–7 years, the industry physically cannot dump usable capacity on the market the way telecom did. The depreciation risk therefore expresses itself less through physical stranding and more through financial structures that assumed residual values — GPU-backed loans and securitizations underwritten on assumptions like "50% residual at three years," set when H100s rented at $8–10/hour and invalidated within nine months by Blackwell (AI Realist). Our verdict: pillar (ii) is correct that depreciation schedules flatter current hyperscaler earnings (watch the gap between EPS growth and FCF — BofA flags exactly this earnings-quality decoupling), correct that the 6-year schedule will likely compress toward ~5 years, but wrong if it implies the assets become worthless in three years. The loss lands on whoever financed the fleet at full residual assumptions, not necessarily on the operator (Yahoo/BofA via Sløk, theCUBE).
The sensitivity of the entire ROI question to the useful-life assumption is worth making explicit, because it is the single highest-leverage variable in the debate. Our depreciation model on Goldman's capex path (compute at ~55% of spend, infrastructure over 12 years):
| Compute useful life | 2026 depreciation | 2028 depreciation | 2030 depreciation | Implied earnings effect vs. 6-yr GAAP norm |
|---|---|---|---|---|
| 3 years (Burry/Princeton frontier-training view) | ~$335B | ~$690B | ~$1,007B | 2028 depreciation +42% vs. 6-yr; consistent with Burry's ~$176B cumulative understatement estimate |
| 5 years (Amazon's partial move; theCUBE's predicted convergence) | ~$223B | ~$552B | ~$899B | 2028 depreciation +14% vs. 6-yr; a "quiet repricing" of hyperscaler EPS |
| 6 years (current GAAP norm) | ~$196B | ~$484B | ~$837B | Base case; already absorbs ~68–81% of current AI revenue (Conard/Azhar) |
Two implications follow. First, even under the industry-standard 6-year assumption, depreciation alone absorbs the overwhelming majority of current AI revenue — the margin of safety is thin before any discussion of returns above depreciation. Second, a one-year compression of assumed lives (6→5) is worth roughly $50–70B of annual pre-tax earnings across the complex by 2028 on this path — larger than the total 2025 net income of most individual hyperscalers' cloud segments — which is why the useful-life debate is not an accounting footnote but a first-order valuation variable. The market currently prices hyperscaler EPS on the 6-year convention while simultaneously pricing neocloud credit as if the true life were closer to three; one of those prices is wrong, and the reconciliation (Amazon shortening, Meta extending, auditors signing both) will likely be forced by the 2027–28 vintage of filings rather than by debate.
2.3 Pillar (iii): Overbuild Under Optimistic Expectations2.3 支柱(三):乐观预期下的过度建设
This is the pillar where history speaks loudest, and the parallels have sharpened rather than faded over the past year. The telecom template: over $500B spent on fiber between 1996–2001, capacity up ~186,000x by Craig Moffett's math, only ~2.7% of fiber lit by 2002, and a decade of impairments even though the infrastructure ultimately proved valuable to its second owners (Fabricated Knowledge, Sparkline via Investing.com). The AI cycle is displaying the classic overbuild signature: every forecast has been too low, repeatedly, which is precisely how overbuild happens — guided 2026 capex is 158% above the estimates made in September 2024, and consensus 2027 has already been revised up ~39% to ~$935B–1.1T (I/O Fund). FOMO-driven game theory ("we'd rather overbuild than lose") is openly stated by management, and the marginal supply is being added by the weakest hands: Oracle carrying the $300B OpenAI contract on its own balance sheet (S&P cut it to BBB- in July 2026; shares down ~25% YTD as of spring; Barclays had already gone Underweight on a 500% debt-to-equity ratio), and neoclouds whose entire enterprise is the capital structure — CoreWeave with ~$24.9B of debt against $4.8B of equity, current ratio 0.46, interest expense of $536M in Q1 2026 alone (26% of revenue), and FCF of -$4.7B (FactSet, Dave Friedman, Global Data Center Hub).
Circular financing is the accelerant that makes this cycle's overbuild structurally different from a normal capex overshoot. OpenAI has assembled ~$1.4 trillion of compute and infrastructure commitments against ~$25–40B of annualized revenue, funded through a web in which Nvidia invests in OpenAI (up to $100B announced; Huang said in March 2026 the full amount is "not in the cards"), AMD granted 160M-share warrant packages to both OpenAI and Meta against GPU purchase commitments, Oracle builds $300B of capacity for OpenAI while buying Nvidia chips to fill it, and Nvidia holds equity in CoreWeave while guaranteeing $6.3B of its unsold capacity through 2032 (Fortune, BlockEden, Columbia, Highline). One estimate puts circular arrangements at ~$800B; New Street Research estimates each $10B Nvidia invests in OpenAI returns ~$35B in GPU purchases — a 3.5x "return" that is only as good as OpenAI's financing chain (BlockEden, Columbia). UBS's fair counterpoint is that circularity is a minority of Nvidia's revenue (~13% of projected 2026 sales for the OpenAI arrangement) and milestone-gated rather than the fixed vendor financing of 2000 (UBS). But the credit market has started voting: CoreWeave 5-year CDS trades around ~700bp (implying a ~40–55% five-year default probability), Oracle ~200bp, and hyperscaler bond order-book coverage fell from ~5x in February to under 2x by July 2026 (AI Realist, State Street).
The mitigant, again, is physics. Unlike fiber, AI capacity cannot actually be delivered as fast as the commitments imply: the binding constraints are transformers, gas turbines, grid interconnection, and craft labor, which is why "sold out" and "overbuild" coexist — sold out energized capacity, overbuilt commitments on paper (Introl, CFR). Goldman expects its leading indicators (memory prices, GPU rental prices, Taiwan/Korea equipment imports) to roll over before capex does; as of August 2026 "all leading indicators rank near the top end of their range since 2022" (Goldman Sachs). Verdict on pillar (iii): validated as the cycle's central fragility, with the caveat that the overbuild will first manifest in the 2027–29 vintage of financed capacity (neoclouds, Oracle's Stargate book, SPV structures) rather than in hyperscaler utilization statistics. The tell is already visible: Microsoft's RPO is 45% one customer; CoreWeave's investment-grade tranche is rated on Meta's credit, not its own; Meta itself is reportedly exploring selling excess compute as a cloud business (Futurum, Global Data Center Hub, FactSet).
2.5 Sizing the Prize: A TAM Frame for the Required Revenue2.5 市场规模测算:所需收入的 TAM 框架
The cleanest way to see why the required-revenue math is so demanding is to compare it against the pools it must draw from. The ~$1.7–2.0T of annual AI revenue needed by 2030 (our model; Bain's estimate) implies capturing, within four to five years, some combination of: a meaningful share of the ~$1T global IT spend pool (Gartner pegs total worldwide AI spending at $2.59T in 2026, but that figure includes hardware and infrastructure, not the end-user services layer that must carry the margin) (aibusinessweekly/Gartner); a slice of the ~$11T global labor-cost pool addressable by knowledge-work automation (Acemoglu's task-based estimate — only ~5% of tasks cost-effectively automatable near-term, worth ~0.9% of GDP over ten years — is the bear's anchor; Goldman's Briggs counters with 25% task automation, ~9% productivity uplift and 6.1% GDP impact, which if realized would make the revenue requirement trivial) (AIC-IIITH/GS, Goldman Sachs); and advertising/commerce reallocation, where Meta's AI-driven targeting gains are the clearest proof point but are share-shift within a ~$1T pool rather than new demand. The US productivity data are encouraging but not yet exculpatory: growth has run ~2.2% annualized since mid-2022, above the 2010s baseline, though Syverson and others attribute much of it to post-pandemic reallocation rather than AI, and Sløk notes there are no signs of margin expansion outside the tech sector — the "front-loaded valuations today versus slower cash-flow reality" gap in his phrasing (Conard roundup, Fortune/Apollo).
The SAM/SOM discipline matters for positioning: the addressable pool is enormous, but the obtainable pool in the depreciation window (call it 2026–2029, the period over which the current silicon vintage must pay for itself) is what counts for ROI on today's capex. AI-ecosystem revenue at a ~$175B run rate mid-2026 against a ~$1.7T 2030 requirement means the industry must capture roughly 6–8% of global IT spend as net new AI revenue within four years, or demonstrate labor-cost substitution at a scale no general-purpose technology has achieved that quickly. This is not impossible — the Anthropic ramp shows how fast enterprise budgets can move when a use case (coding) demonstrably pays for itself — but it defines why we cap the bull case at ~25%: it requires not one but several coding-scale success stories across legal, finance, customer operations, and back-office automation, all converting simultaneously, while the survey evidence (5–8% ROI realization, 56% of CEOs reporting no benefit) says the conversion machinery is still being built (ValueAdd VC, PwC via Master of Code).
2.4 Pillar (iv): Token Price Deflation2.4 支柱(四):Token 价格通缩
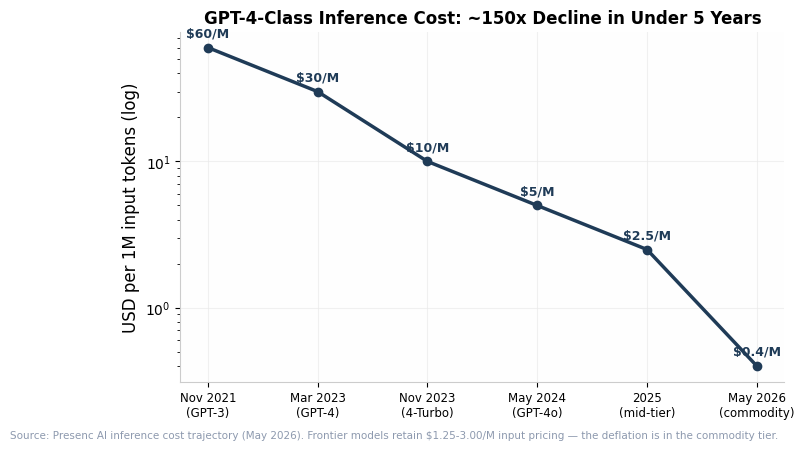
The deflation premise is factually correct and routinely understated. GPT-4-class inference has fallen from ~$60 per million input tokens (November 2021) to roughly $0.40 (May 2026) — a ~150x decline, or ~10x per year, driven by MoE architectures (3–5x compute reduction), serving optimizations (2–3x), hardware competition (~40% inference cost decline since 2024), and open-source price pressure (Presenc AI, AIMagicX, Introl). Frontier pricing has held far better — $1.25–3.00/M input for GPT-5/Claude Sonnet/Gemini Pro class — so the market is bifurcating into a commoditized tier approaching free and a capability-premium tier (DeployBase).
Where pillar (iv) needs qualification is the demand response. The evidence through mid-2026 supports Jevons, not revenue destruction: Azhar's tracking finds each 10% token price cut drives 12–18% more usage, and Google's monthly token processing went from 9.7 trillion (May 2024) to 480 trillion (May 2025) to 3.2 quadrillion (May 2026) — 7x y/y, 330x in two years; Microsoft processed 100T+ tokens in its April quarter, +5x y/y; Goldman's May 2026 forecast of 47 quadrillion monthly tokens by 2028 already looks conservative against an 11Q/month run rate (Conard/Azhar, Google, Beth Kindig/I-O Fund). Falling unit prices with elasticity >1 means total compute spend rises — which is bullish for infrastructure utilization and bearish for model-layer pricing power simultaneously. The correct formulation of pillar (iv) is therefore distributional: token deflation transfers the economic surplus from the model layer to the application layer and end users, compressing the very revenues (frontier-lab API dollars) that anchor the circular financing chain. There is also a subtle negative feedback the bears underweight: OpenAI's newest models are reportedly ~54% more token-efficient per coding task — great for buyers, awkward for anyone modeling revenue as tokens sold, and a direct threat to the "$X per GW" revenue math Cahn uses (AI Weekly).
2.6 The Capex Perimeter: Energy, Grid, and Cooling Investment Driven by AI2.6 资本开支外围:AI 驱动的能源、电网与冷却投资
The headline hyperscaler capex numbers understate the cycle's true footprint. Widening the lens to power generation, grid infrastructure, cooling, and the utility rate base roughly doubles the observable investment surface — and, critically for the ROI debate, the economic character of this outer layer is fundamentally different from the compute layer.
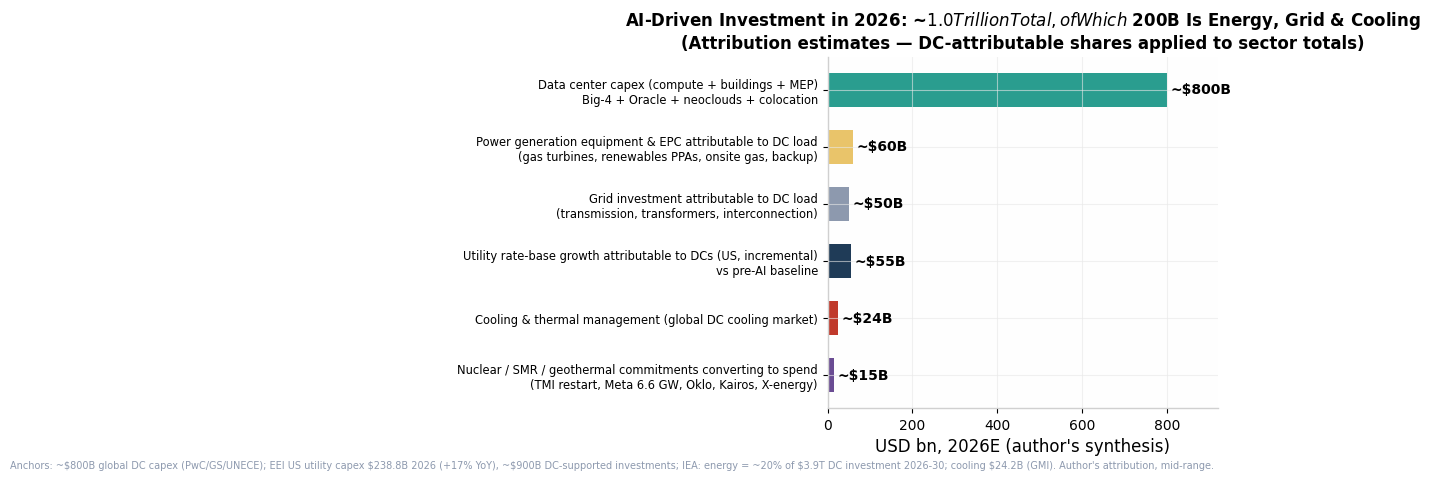
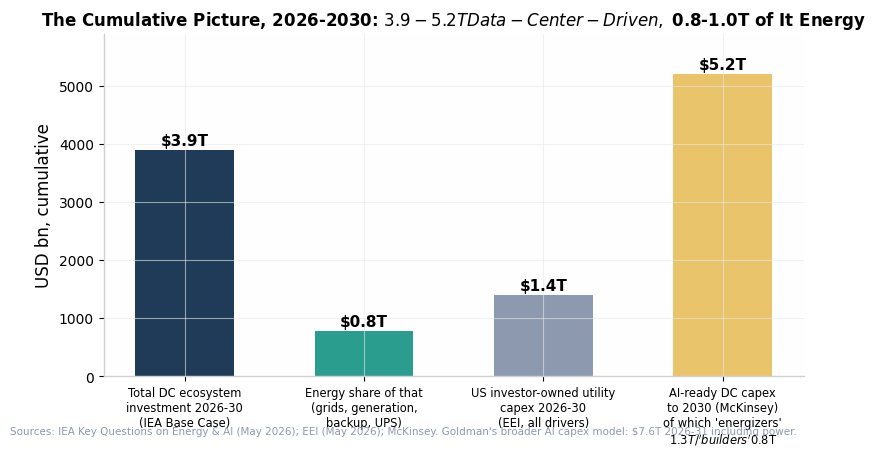
2026 snapshot (author's synthesis of the sources below): global data center capex runs at ~$800B/yr (PwC's central scenario, consistent with Goldman's ~$1T "augmented" global measure) (PwC). The IEA estimates that of the $3.9 trillion cumulative global data center investment from 2026–2030 in its Base Case, ~20% — roughly $780B — is energy-related (grid connections, generation, backup generation, UPS); powering data centers requires $0.5–1.0 trillion of cumulative investment through 2030, against ~$18T of total energy-sector investment over the same period (IEA). Layering in the AI-attributable share of utility capex, grid expansion, generation equipment, cooling, and nuclear commitments, total AI-driven investment in 2026 is on the order of $1.0–1.2 trillion, of which roughly $200–250B sits in the energy/grid/cooling perimeter. Cumulatively through 2030, the data-center-driven ecosystem totals $3.9T (IEA) to $5.2T (McKinsey's AI-ready estimate), with the "energizer" layer — power generation, transmission, cooling, electrical equipment — at $0.8–1.3T (Avid/McKinsey).
| Layer | 2026E scale | Cumulative / forward commitment | AI-attributable signal |
|---|---|---|---|
| US investor-owned utility capex | $238.8B in 2026, +17% y/y — the 14th consecutive record year | $1.4T for 2026–30, revised up from $1.1T a year earlier; EEI tracks $900B of investments supporting 55+ GW of data-center load (EEI) | Generation's share of utility capex rose from 24% (2020) to 30% (2025); data centers are the largest single incremental load driver — Grid Strategies' 128 GW five-year load-growth forecast is DC-concentrated (POWER/EEI) |
| Individual utility programs | Duke $103B (2026–30), NextEra ~$94B, Southern $78B (up 73% vs. prior plan), Dominion $55B | Top-10 US utilities >$1.4T through 2030; 16 of 20 majors now run negative FCF — capex is capital-markets-funded (Tech-Insider, Cognitive Credit) | Dominion: 28% of sales tied to data centers, 51 GW contracted pipeline; NextEra–Dominion merger explicitly premised on AI load |
| Global grid investment | ~$400B/yr today | IEA: must rise ~50% by 2030; >2,500 GW of projects stalled in interconnection queues; grid component prices ~doubled in five years (IEA) | Goldman: >$700B of US grid investment through 2030 (Goldman Sachs) |
| Transformers / grid equipment | Prices +70–100% since pre-boom; lead times 30–60 months | US facing a 30–40% power-transformer supply shortfall; Hitachi Energy committing $1.5B of capacity expansion 2025–28 (Enki/Hitachi) | GEV Electrification backlog +69% y/y to $41B; Siemens Grid Technologies backlog €51B (Utility Dive, Turbomachinery Intl) |
| Gas turbines / generation equipment | Record 38 GW of global orders in Q2 2026, +71% y/y; ~110 GW of annual orders vs. 60–70 GW of manufacturing capacity | Combined big-three backlog ~220 GW: GEV 116 GW (53 GW firm + 63 GW slots, ~20% DC-explicit, delivery slots into 2031), Siemens 69 GW firm (~28% DC), MHI 35 GW (OilPrice, Natural Gas Intel) | GEV Power orders +134% y/y; equipment pricing +20%+ in H1 2026; IEA: 15–27 GW of onsite gas likely powering data centers by 2030, requiring 30–70% generation overbuild |
| Cooling / thermal management | Global DC cooling market ~$21–24B in 2026; liquid cooling ~$6.4–6.8B, growing at 22–31% CAGR | Cooling to ~$55–69B by 2034–35; liquid cooling to $16–19B by 2030–31 (GMI, Mordor) | AI/ML workloads = ~35% of liquid-cooling spend and fastest-growing; rack densities >30 kW make liquid mandatory for AI silicon |
| Nuclear / SMR | Modest current spend; large commitments | 45 GW of SMR capacity announced for data centers (25 GW by end-2024 + 20 GW in Jan 2026); Microsoft's ~$16B Three Mile Island restart; Meta 6.6 GW across Vistra/Oklo/TerraPower; Amazon $700M into X-energy + 1.92 GW Talen PPA; Google 500 MW Kairos; Oklo >$10B invested, 14 GW pipeline (IEA, Latitude Media, iRecruit) | First commercial SMRs ~2030 — a 2028+ story, not a 2026 revenue driver; treat announcement GW as optionality, not backlog |
Three observations matter for the investment thesis. First, the IEA's own framing cuts against a systemic energy-sector bubble: at $0.5–1.0T of a projected ~$18T in total energy investment through 2030, data centers are not driving unusual growth in energy-sector market capitalization overall — the exposure is concentrated in specific pockets (gas turbine and grid equipment OEMs, SMR developers, hotspot utilities) where outcomes "will depend not only on the outlook for data centre demand but also on the investment strategies adopted by companies" (IEA). This is the mirror image of the compute layer: the depreciation/obsolescence mechanism that threatens GPU economics does not apply to 40-year transformers, regulated rate base, or contracted PPAs. The perimeter layer earns utility-like returns on scarce, long-lived assets — which is precisely why it anchors the overweight side of the barbell recommended in Section 6.
Second, the perimeter is where demand-scrubbing is already visible, providing an early-warning function for the whole cycle. Exelon cut its "high probability" data-center load forecast from ~18 GW to ~11 GW in a single quarter (July 2026) and its broader interconnection pipeline from ~43 GW to ~25 GW, explicitly weeding out speculative projects; only ~4 GW carries signed transmission agreements backed by collateral (OilPrice). Turbine OEMs have structurally de-risked themselves — GE Vernova's backlog is half slot reservations (paid options), and customer down payments contributed a $6.4B working-capital benefit in Q2 2026 — meaning the customers, not the OEMs, now carry the cancellation risk in this layer. And the political economy is tightening: data centers drove $7.3B (82%) of the increase in PJM's capacity-auction revenue, E3 attributes ~50% of the capacity-price rise to load growth, and legislators in at least 28 states have introduced bills to roll back data-center incentives (Utility Dive, E3, Enki).
Third, a caveat that preserves symmetry: the utility layer is not risk-free. Sixteen of twenty major US utilities are running negative free cash flow to fund these programs (Dominion -$7.4B LTM at a 71.5% capex/sales ratio), making the sector dependent on continuous capital-market access at exactly the moment rates are rising (Cognitive Credit). In the bear scenario (Section 3), the perimeter does not blow up — regulated assets with signed tariffs rarely do — but hotspot-utility equity de-rates, the speculative half of the load pipeline evaporates, and the "sold out" turbine narrative unwinds into 2030-vintage slot availability. The perimeter is where you hide from the compute cycle's depreciation risk, not where you hide from a demand shock.
3. Scenario Analysis: Bull, Base, Bear3. 情景分析:牛市、基准、熊市
We frame the scenarios on a 3–5 year horizon (through 2029–30), probability-weighted as of September 2026. The distribution has shifted materially over the past twelve months: the bear tail is fatter (financing structures now exist that can transmit stress), but the bull case is no longer purely narrative (revenue is inflecting, the depreciation crossover has occurred, and FCF recovery is a 2028 consensus event rather than a hope).
Bull case (~25%): adoption catches up to the build. Token volumes keep compounding at >5x/year; agentic workloads (Goldman estimates ~84% of 2030 token volume) convert enterprise pilots into production ROI; the 5–8% ROI-realization cohort expands toward 25–30%; AI ecosystem revenue compounds at ~100%+ through 2028 and approaches the ~$1.5–2T range by 2030–31; hyperscaler FCF recovers on schedule in 2028; the depreciated 2024–25 GPU vintage remains fully utilized for inference as power stays scarce. In this world, 2026's negative-FCF prints look like the 2000s Amazon moment — maximal pessimism at peak investment. Supporting evidence: Anthropic at $65B ARR growing >2x per quarter-annualized with its first profitable quarter; Microsoft's $37B AI run rate; the H100 rental rebound; Google Cloud backlog +55% sequentially (ValueAdd VC, SemiAnalysis, Introl). Even in this scenario, note, returns are uneven: the labs' collective ~$115B of projected cumulative burn through 2029 means the equity value accrues mostly to infra owners and application winners, not to frontier-model equity at current marks (ValueAdd VC).
Base case (~45%): digestion, not bust. This is the "low ROI" scenario the user posits, and we assign it the modal probability. Capex growth peaks in 2026 (+~79%) and plateaus or grows low-double-digit in 2027–28 as boards respond to negative FCF and spread widening; the marginal 2026–27 capacity vintages earn mid-single-digit ROIC, well below the ~15–20% hurdle the market underwrote; depreciation schedules compress from 6 toward 5 years (Amazon-style), trimming hyperscaler EPS growth by several points and validating ~half of Burry's $176B; AI revenue keeps growing 40–70% annually but never fully closes the Cahn gap within the window, so the complex de-rates on "show me" fatigue — multiples compress 20–30% from peak while earnings keep growing, producing flattish index-level returns for AI-exposed mega-caps and violent dispersion underneath (neocloud equity and weak lab credit impaired; profitable monetizers fine). The September 2026 tape is arguably already pricing the front edge of this: Nvidia trades at a ~22x forward P/E — a multi-year low — despite guiding +95% y/y, Alphabet suffered a record one-day drop on a negative-FCF print, and the mid-September rotation out of the capex chain (NVDA -8%, ASML -10%, SoftBank -11% in a week, while Meta rallied 7%) shows the market actively distinguishing capex recipients from capex payers (Yahoo Finance, Globe and Mail/Motley Fool, Yahoo Finance).
Bear case (~30%): telecom replay with a credit trigger. The sequence: a frontier-lab funding gap (OpenAI's modeled ~$14B 2026 loss, ~$115B cumulative through 2029, against $1.4T of commitments) or an Anthropic IPO that prices below its $965B private mark breaks the financing reflex; Oracle's BBB- becomes the first domino in spread space; a neocloud (CoreWeave carries a $4.2B 2026 refinancing wall against depreciated collateral and a securities-fraud class action) restructures, flooding the GPU resale market; residual-value assumptions across ~$120B+ of SPV/ABS structures get re-marked; hyperscalers cut 2027 guidance by 20–40%; the AI complex takes a 30–50% equity drawdown with the S&P 500 — where the top 10 names are ~38% of the cap and CAPE sits at 40.5, second-highest in history — dragged into a correction; Apollo's Sløk notes the 2028 FCF-recovery assumption is load-bearing for the whole index (ValueAdd VC, Dave Friedman, AI Realist, Chase, Chamberlin, Yahoo/Apollo). The bear case does not require AI to fail; it requires only that the financing chain slows before the cash flows arrive — precisely the BIS warning. What caps the downside versus 2000–02: today's leaders are massively profitable (Nvidia: $120B FY26 net income vs. Cisco's $2.7B at peak), trade at ~22–26x forward earnings rather than 100–200x, and can cut capex without existential risk (INDmoney, ICIS).
4. Porter's Five Forces Across the AI Compute Chain4. AI 算力链上的波特五力
A structural lens clarifies where in the stack low ROI will actually land, because the forces play out very differently by layer. The compute chain as of late 2026: supplier power is extreme and concentrated — Nvidia holds the training silicon franchise (~55–60% of hyperscaler AI capex flow-through), TSMC the advanced-node foundry, three vendors the HBM market; this is why ~41% operating margins sit at the silicon layer while the model layer runs at ~-59% (Presenc AI, Fortune/Apollo). Supplier power is, however, peaking: custom silicon (Google TPU v7, Amazon Trainium3, Microsoft Maia, OpenAI/Broadcom's 10GW program, Meta/AMD's 6GW deal) is the hyperscalers' deliberate erosion strategy, and Broadcom's custom-silicon franchise is the cleanest public expression of that force shifting. Buyer power is bifurcated — the frontier labs are simultaneously the largest buyers and the most financially fragile, which is an unstable configuration: their leverage over suppliers grows with scale but their ability to pay depends on the funding chain, not on customers. Enterprise buyers, by contrast, hold genuine and growing power: open-weight substitution (DeepSeek, Llama, GLM, Kimi-class models at $0.14–0.55/M vs. frontier $1.25–3.00/M) caps model-layer pricing indefinitely (DeployBase).
Rivalry is intensifying in exactly the pattern that precedes capital-cycle breaks: five-plus frontier labs, 300+ GPU-cloud entrants in 2025 alone, hyperscalers renting to each other, and Meta contemplating selling its own excess compute — every player adding capacity into the same demand curve (Introl, FactSet). Threat of substitutes operates at two levels the user's pillar (iv) gestures at: algorithmic efficiency (each model generation does more with less compute — the reported 54% token-efficiency gain is a demand-side substitute for hardware) and architectural substitution (inference-optimized ASICs displacing general-purpose GPUs in the workload mix). Barriers to entry are rising in capital terms (a competitive 2026 training cluster costs billions) but falling in technical terms (distillation and open weights let fast-followers reach near-frontier capability at a fraction of the cost), which is the worst combination for incumbent ROI: it forces continued capex to defend position while preventing pricing power from ever developing. The five-forces verdict aligns with the scenario weights: the structure of the compute layer — powerful suppliers, fragile anchor buyers, intensifying rivalry, active substitution — is consistent with low average ROI across the layer even if total demand keeps growing, and it directs capital toward the two layers where barriers are physical and contracted (power/grid, advanced packaging/HBM) rather than financial.
5. What Is Priced In vs. Underappreciated5. 已被定价与被低估的因素
Priced in (or being priced): Nvidia's de-rating to ~22x forward while revenue nearly doubles is the market explicitly discounting capex cyclicality; credit markets are pricing neocloud/lab risk (CRWV ~700bp, ORCL ~200bp vs. megacaps at 50–85bp); the September rotation shows capex-payer/capex-recipient discrimination is consensus; BofA's fund-manager survey already showed a majority calling AI a bubble in late 2025 (Yahoo Finance, State Street, Columbia). An investor who merely "agrees with the bubble thesis" is not early.
Underappreciated, in our judgment: (1) The earnings-quality gap — hyperscaler EPS growth decoupling from FCF, with depreciation policy the swing factor; if schedules compress industry-wide toward 5 years, 2027–28 EPS estimates come down mechanically even with zero change in demand. (2) The off-balance-sheet stack — ~$3T of commitments, ~$1.1T of unrecognized lease obligations, and ~$1.5T of purchase commitments mean reported leverage understates committed capital intensity; this is where "low ROI" converts to "structurally lower FCF margins for the mega-caps even in the base case" (WSJ via Conard, J.P. Morgan AM). (3) The application-layer surplus transfer — token deflation plus the $2T+ SaaS selloff triggered by agentic tools (e.g., Claude Cowork) means the value migration from infrastructure and legacy software to AI-native applications is further along than index-level analysis shows (SaaStr). (4) Power as the actual moat — the constraint that prevents fiber-style stranding also concentrates returns in whoever controls energized capacity: utilities with signed PPAs, grid equipment, cooling, and natural gas/turbine suppliers have contracted, inflation-linked revenue that does not depend on model-layer economics.
5.5 Credit Addendum: Independent Assessment of the Project Jupiter / Neocloud Debt Analyses5.5 信贷附录:Project Jupiter / 新云债务分析的独立评估
(Assessment of three user-supplied documents: "Systematic Re-Pricing in Digital Infrastructure," "Oracle New Mexico Data Center Debt Analysis," and "Financing the AI Supercycle." All claims independently verified against primary and market sources as of September 25, 2026.)
5.5.1 Verification Scorecard5.5.1 核实记分卡
The three documents are, in substance, accurate and well-sourced — this is not the hallucinated-content pattern sometimes seen in AI-generated dossiers. The load-bearing claims check out: Oracle did send a force majeure notice to Stack Infrastructure (Blue Owl) on Project Jupiter in late September 2026, confirmed on the record to CNBC after Bloomberg's reporting, with the Green Chile pipeline delayed to February 2027 after two State Land Office denials and an air-permit decision pending November 23 (Reuters via Insurance Journal, CNBC via acast); the $18B syndicated loan (Santander/Jefferies-led, ~20 banks, arranged November 2025) is quoted at 89–91 cents (FT, TIKR); S&P downgraded Oracle to BBB-/A-3 on July 9, 2026 (S&P Global); Oracle's 5-year CDS hit records around 198–215bp versus ~115bp for the BB index (Kobeissi/X, Conard/Gave); FY2026 figures — capex $55.7B (82.6% of revenue), FCF -$23.7B, debt $124.7B, plus $248B of future lease obligations not yet on balance sheet — match the Q4 filings coverage (Conard/Gave, Yahoo Finance); the Texas ERCOT audit/moratorium (~474GW queue, 49.8GW ≈ 20% of the US pipeline at risk, up to $8–15B revenue at risk per BNEF) and the Data Center Watch figures ($130B Q1 + $68B Q2 2026 disrupted, 843 opposition groups in 49 states, 30+ statehouses acting) are all confirmed (POWER, Bloomberg, Data Center Watch). The BoE July 2026 FSR material on SRTs and maturity mismatch is genuine and correctly characterized (Bank of England).
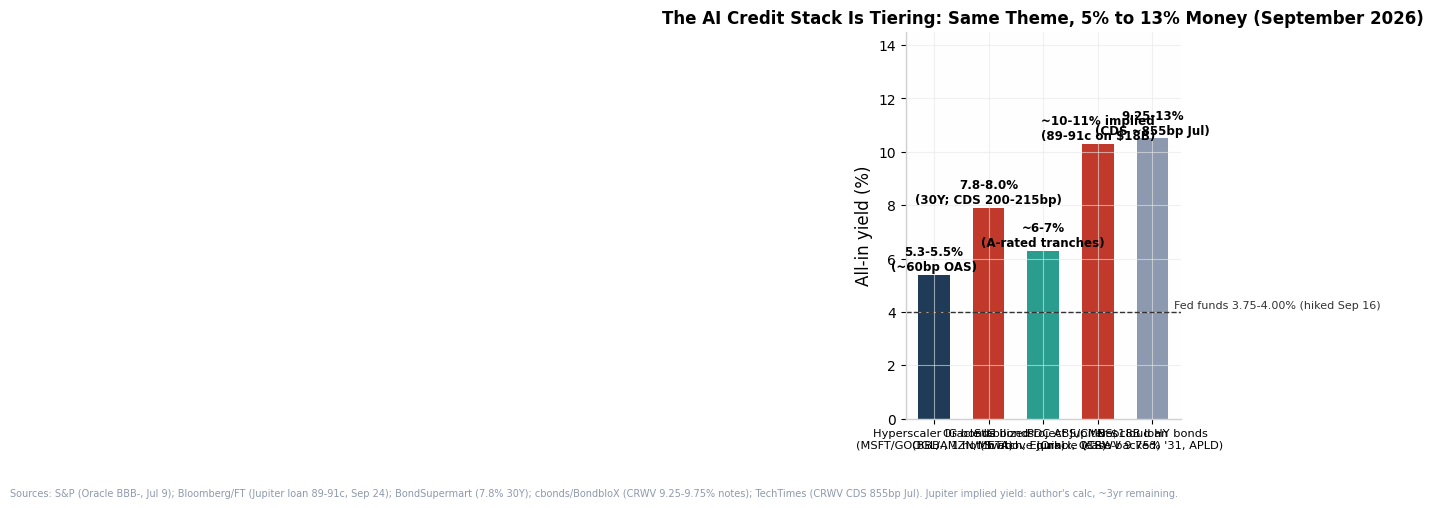
That said, four corrections and caveats are warranted. First, an internal data error: one document states Blue Owl committed "$313 billion in equity" to the Jupiter SPV — the correct figure is ~$3 billion (the $313B appears to be a decimal error). Second, the documents overstate the neocloud distress as a stable state rather than a whipsaw: CoreWeave credit has round-tripped violently — CDS 881bp in December 2025 → 452bp by June 2026 (Applied Digital repriced CoreWeave-linked debt from 10% to 7% amid 5x oversubscription) → 855bp by late July (~50% implied 5-year default probability) — and CoreWeave successfully launched a $3B convertible on September 17, 2026, with the equity still up ~16% YTD (Bloomberg, TechTimes, Reuters). The "11.6–13% yields, high-80s cash prices" figures cited are plausible for the July trough but were not independently confirmable for late September; treat them as a range that moves 300–400bp within a quarter. Third, the force majeure is defensive, not terminal: Oracle has not missed payments, remains the tenant, and only ~1.2GW of Bloom's 2.8GW master supply agreement is actually contracted to this site — Bloom can redirect equipment (GridReadiness). Fourth, the "$165B" Jupiter figure that appears in some coverage refers to 30-year Industrial Revenue Bond authorization (a tax-abatement mechanism), not the project's cost — the actual debt at risk is the $18B syndicated loan plus ~$3B sponsor equity.
5.5.2 (i) Probability Assessment: How Likely Are Credit Problems?5.5.2(一)概率评估:出现信用问题的可能性有多大?
The correct frame is a tiered ladder of credit events with very different probabilities, not a single "AI credit crisis" variable. Our assessment, 24–36 month horizon:
| Event | Probability | Basis |
|---|---|---|
| More Jupiter-type marks: additional greenfield project loans trading <95¢, hung syndications, delayed drawdowns | ~75% — already the base rate; $198B of H1-2026 projects disrupted, 20% of the US pipeline under the ERCOT audit, and the 89–91¢ Jupiter print now serves as the pricing comp for every follow-on deal (Bloomberg) | |
| At least one significant neocloud/developer default or distressed restructuring (CRWV-tier or below) | ~45–55% — CoreWeave's own CDS implied ~50% 5-year default probability at the July trough; interest expense is ~25% of revenue, net debt/EBITDA 10.75x, and the model requires continuous capital-market access against $31–35B of 2026 capex (TechTimes, ValueAdd) | |
| AI-credit bear market: structurally wider spreads, issuance windows shut for sub-IG names for 2+ quarters | ~60% — in progress; even QTS's $3.9B IG deal "priced at levels normally associated with junk," and Galaxy paid 10% for CoreWeave-lease-backed bonds (Briefs/GS) | |
| Oracle fallen angel (cut below BBB- → forced IG-index selling of ~$117B bonds) | ~25–30% by FY2028 — S&P's trigger is ~4x adjusted leverage; Morgan Stanley judges imminent downgrade unlikely given equity-issuance countermeasures (the $20B ATM proves willingness), but the market disagrees with the agencies: CDS at 200–215bp vs. the BB index at ~115bp means Oracle trades worse than the average BB credit while rated BBB- (Conard/Gave) | |
| Systemic banking crisis transmitted through AI debt (2008-style) | ~5–10% — the BoE notes the outstanding stock is still modest, direct bank exposure averages ~9% of Tier-1 capital (Chicago Fed), and SRTs disperse first-loss to NBFIs; the tail risk is opacity — regulators cannot see where SRT losses land — not scale (Bank of England) |
An illustrative expected-loss sizing across the riskiest tiers — ~$40B greenfield project loans, ~$35B neocloud HY, ~$25B GPU-backed ABS/SPV paper, using moderate PD/LGD assumptions — yields roughly $13–16B of expected credit losses over three years, plus a similar magnitude of mark-to-market pain already embedded. That is absorbable by the banking system (and is precisely what SRTs are designed to move off bank balance sheets), but it is catastrophic for the specific equity and first-loss holders — Blue Owl's SPV equity, SRT first-loss tranches, neocloud unsecured creditors, and GPU-residual guarantors. The asymmetry is the point: systemic probability is low, idiosyncratic loss severity is high, and the market is repricing severity before probability.
5.5.3 (ii) The Rate-Hiking + Inflation Regime: Transmission Into Capex, ROI, and Construction5.5.3(二)加息与通胀环境:对资本开支、投资回报与建设进程的传导
This is where the documents under-develop the analysis, and where the September 2026 macro turn matters most. On September 16 the Fed hiked 25bp to 3.75–4.00% — its first increase since July 2023 — with 16 of 18 officials projecting at least one more hike this year and the median path holding ~4.1% through 2027; the 10-year Treasury has crossed 5% (highest since 2007), the 30-year ~5.44%, PCE inflation is running 3.7% with the Iran-war energy shock (crude ~$100, record diesel) still feeding through (Goldstone recap, The Well News). The transmission into the AI build runs through five channels:
1. Reflexivity — AI capex is now a cause of the rates that threaten it. Long-end yields are being pushed up partly by the AI investment boom itself: stronger growth expectations, massive duration supply ($194B of hyperscaler IG in H1 2026 alone), and competition for capital. The Dallas Fed's Texas outlook explicitly notes that "surging investment related to data centers and the AI buildout could also be contributing to elevated long-term interest rates," and the WSJ attributes part of the 10-year's move above 5% to "borrowing by data-center operators" (Texas A&M/Dallas Fed, The Well News). Apollo's Sløk calls the result "self-throttling": the capex cycle raises its own cost of capital until marginal projects fail NPV. This is the single most important structural change since our base report was written.
2. The arithmetic of marginal-project death. Greenfield projects underwritten at ~6–7% all-in construction debt now face: 10-year at 5% + wider credit spreads + the Jupiter comp. A project that penciled at a 7% WACC with a 2028 energization date does not pencil at 9.5–11% debt and a 2029–30 energization date. Our calculation: the 89–91¢ Jupiter marks imply an all-in yield of roughly 10–11% on paper originally priced around ~6.3% — a ~400bp re-rating of execution risk alone, before the rates move. Every 100bp on Oracle's $125B debt stack is ~$1.25B of annual pre-tax cost against a projected FY2027 FCF deficit of -$42B. CoreWeave already spends ~25% of gross revenue on interest at 10.75x net leverage; it has no maturities until 2029, but its business model requires continuous new issuance at whatever the market charges — which is why its equity fell 12% on a single August session when the 30-year hit 5.32% (ValueAdd).
3. Inflation compounds construction cost while delays compound carrying cost. Turbine pricing is up 20%+ in H1 2026, transformers +70–100% with 30–60 month lead times, and the energy shock raises both construction input costs and the operating cost of behind-the-meter gas. Meanwhile ASC 842 build-to-suit accounting (correctly explained in the documents) means tenants like Oracle accrue capitalized interest on SPV liabilities throughout delays — the "temporal inversion" the documents describe is real, and at 5%+ rates the capitalized carry on a stalled multi-billion-dollar project runs into hundreds of millions per year before a single dollar of revenue.
4. The political-economy channel: inflation makes data centers a ratepayer issue. The Iran-driven energy spike lands directly on electricity bills; PJM's capacity auction already showed data centers driving 82% of the revenue increase, and E3 attributes ~50% of capacity-price rises to load growth. In an inflationary environment, every moratorium (Texas, New York, Illinois, Maine's near-miss) and every one of the 843 opposition groups gains political force, because the public cost is visible on utility bills — this is how a permitting nuisance becomes a durable regulatory regime (Bloomberg).
5. Net effect on capex/ROI/construction — the self-throttling path. Our revised central expectation: 2026 capex guidance (~$725–745B Big-4) gets delivered, but 2027 guidance flattens or is cut, led by Oracle (which cannot fund $90–95B of FY27 capex at 8%+ debt costs and a -60% share price indefinitely) and the neocloud segment. Construction slows at the margin precisely where the documents point — single-tenant greenfield — while stabilized multi-tenant ABS continues clearing (the SEC's July–August master-trust guidance helps). The paradoxical second-order effect: supply discipline is bullish for existing capacity economics — fewer energized MW in 2028–29 supports the H100-rental rebound and incumbent utilization, which is why "credit stress" and "tight compute" can coexist. For ROI specifically, higher rates + delays push the revenue-recognition point right while the depreciation clock keeps running, which raises the probability of the low-marginal-ROI outcome we modeled (base case 45% → arguably 50%) and fattens the bear tail (~30% → ~35%) — with the mechanism now being financing-and-execution failure rather than demand failure. The bull case is largely unaffected, since it was always predicated on revenue, not financing.
5.5.4 Positioning Implications of the Credit Turn5.5.4 信贷转向的持仓含义
The credit market is handing investors a free monitoring system and a relative-value map. Monitor: Jupiter loan marks (a break below 85¢ signals lenders pricing restructuring, not delay); Oracle CDS versus the BB index (the 85–100bp gap is the market's downgrade forecast — closure via tightening would be the all-clear; Moody's already has a negative outlook); the ERCOT December 10 audit filing and New Mexico's November 23 air-permit decision as the two near-term binary dates; CoreWeave's convert pricing and Q4 issuance costs as the sector's marginal-cost-of-capital benchmark. Express: the documents' central insight — that SPV/DSCR structures do not protect against tenant-credit and temporal risk — argues for owning the tenants' secured paper over the developers' project paper at similar yields, avoiding GPU-residual-dependent ABS tranches where recovery assumptions (40% at year three) rest on Broadcom-style guarantees that have never been tested through a default, and treating Blue Owl and pure-play private-credit managers with AI-infra books as the equity lever on this theme (Blue Owl hit a one-year low on the Jupiter news). For family offices with private credit allocations, the look-through question is now urgent: how much of the book is first-loss SRT paper or GPU-collateralized SPV tranches whose recovery models assume silicon holds value the secondary market is already disputing.
5.6 Addendum: The 2000–02 Analog — Probability of QQQ Underperforming Non-Tech5.6 附录:2000–02 年类比——QQQ 跑输非科技板块的概率
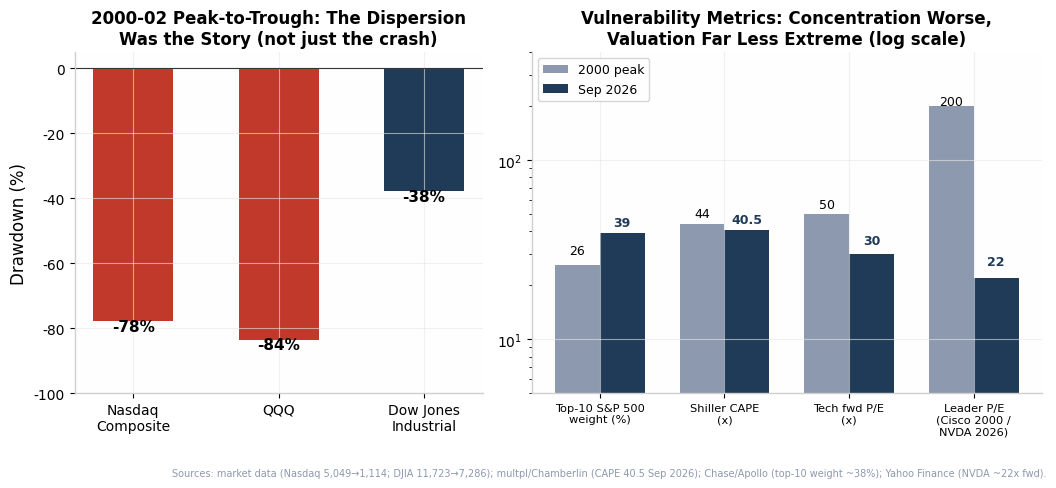
The 2000–02 episode is the right benchmark, but it must be decomposed into two distinct outcomes that carry very different probabilities. The historical record: Nasdaq Composite fell -77.9% peak-to-trough (5,049 on March 10, 2000 to 1,114 on October 9, 2002), QQQ fell ~83.5%, while the Dow Jones Industrial Average fell -37.8% over the same window — and the Nasdaq did not reclaim its nominal peak until April 2015, roughly 15 years later (sooner, ~2013, on a total-return basis). The defining feature was not merely the crash but the ~46pp dispersion between growth and value indices, driven by valuation compression in profitless tech while cash-generative old-economy names held up. Note that 2022 already provided a rehearsal of the rate-driven version of this trade: QQQ fell ~32.6% while the Dow fell ~7–9%, a ~24pp gap in a single calendar year.
Calibrated probabilities, 24–36 month horizon from September 2026:
| Outcome | Probability | Rationale |
|---|---|---|
| QQQ underperforms Dow/value by >20pp (rotation; multiples compress, earnings fine) | ~55% | Concentration is ~50% worse than 2000 (top-10 ~38–39% of S&P vs ~25–27%), CAPE 40.5 vs 44 at the 1999 peak, the Fed is hiking with the 10-year above 5%, and 2022 proved the mechanism works with profitable companies |
| 2000-style dispersion with a deep tech drawdown (QQQ -35% to -50% while Dow falls <25%) | ~30% | Requires the credit/execution trigger (Section 5.5) plus demand disappointment; today's leaders are profitable (tech fwd P/E ~30 vs ~50 in 2000), so the drawdown comes from multiple compression on real earnings rather than extinction of earnings |
| Full 2000–02 severity (QQQ -70%+, 15-year recovery) | ~10% | Requires earnings collapse, not just multiple compression: Nvidia at ~22x forward with +95% guided growth has no 1999-Cisco (~200x) analog; the failure would need to reach the mega-caps' core revenue, not just the capex line |
The asymmetry versus 2000 runs in both directions. Protective: the leaders generate hundreds of billions in actual free cash flow (pre-capex), buy back stock, and trade at roughly half the sector multiple of 2000. Adverse: index concentration is worse, so passive flows amplify the drawdown mechanically; the capex is now debt-funded, adding a credit channel that 2000's telecom bust had but today's tech equity story has not yet fully priced; and the trigger regime is a rate-hiking cycle, the same regime that produced 2022's 24pp dispersion. The practical expression is exactly the barbell already recommended: the QQQ/Dow relative trade is the liquid proxy for "capex payer vs. capex beneficiary," and it is the cheapest way to hold the bear case without shorting a revenue stream that is still doubling.
5.8 Horizon Framework: Reconciled Scenario Tree with Return Magnitudes5.8 期限框架:经调和的情景树与回报幅度
The scenario probabilities and the QQQ/Dow synthesis are reconciled through a single scenario-conditional return model (400k Monte Carlo draws; returns are cumulative over the stated window). Two corrections to earlier point estimates: Year-1 P(QQQ>Dow) refines to ~40% (from ~45%) and 3–5yr P(QQQ>0) to ~80% (from ~70%). Key structural insight: P(outperform) ≠ P(bull), because the base case embeds dispersion around parity — roughly a coin-flip within base.
| Horizon | Scenario (prob) | QQQ | Dow | Gap |
|---|---|---|---|---|
| Year 1 | Base (45%): guidance flattening, FCF trough | -2% ± 13 | +3% ± 7 | -5pp |
| to Sep 2027 | Bull (25%): ROI inflection, capex raised again | +28% ± 15 | +10% ± 8 | +18pp |
| Bear (30%): credit event, capex cut | -32% ± 12 | -12% ± 7 | -20pp | |
| Weighted | mean -4%, median -4% | mean 0% | -4pp | |
| Years 2–3 | Base (50%): muddle-through, multiple compression ≈ EPS growth | +5% ± 23 | +18% ± 11 | -13pp |
| to mid-2029 | Bull (25%): demand catches up, FCF recovery | +70% ± 25 | +30% ± 12 | +40pp |
| Bear (25%): financing break, telecom replay | -30% ± 18 | +2% ± 9 | -32pp | |
| Weighted | mean +12%, median +5% | mean +17% | -5pp | |
| Years 3–5 | Bull (35%): validated platform, productivity sustained | +120% ± 30 | +50% ± 15 | +70pp |
| to ~2031 | Base (40%): commoditized utility, parity | +55% ± 35 | +55% ± 20 | ~0pp |
| Bear (25%): stranded overbuild, slow recovery | -10% ± 25 | +25% ± 12 | -35pp | |
| Weighted | mean +61%, median +64% | mean +46% | +16pp |
Resulting probabilities: Year 1: P(QQQ>Dow) ~40%, P(QQQ>0) ~44%. Years 2–3: ~40% / ~55%. Years 3–5: ~57% / ~81%, expected gap +16pp cumulative.
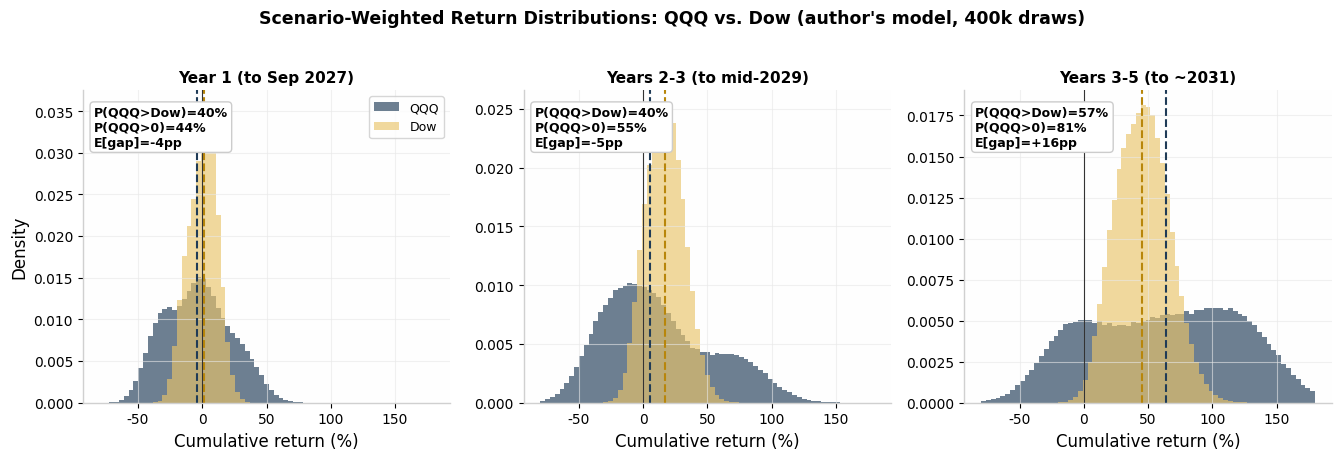
The asymmetry is the point: QQQ's expected return exceeds the Dow's at every horizon beyond year 1, but its distribution is wider and left-skewed — the bear case costs QQQ ~35pp of relative performance while the bull case adds 40–70pp. This is why the position-sizing conclusion (barbell, relative-value, staged entry on guidance) diverges from the expected-return conclusion: the median long-horizon outcome is favorable, but the path risk is concentrated in the next 18 months.
6. Investment Implications6. 投资含义
6.1 By Layer of the Stack6.1 按产业链层级划分
| Layer | Verdict under base/bear (70–75% combined) | Positioning implication |
|---|---|---|
| Semis (NVDA, AMD, AVGO, memory) | Real earnings, but demand is a derivative of capex guidance; NVDA's 22x fwd P/E is compensation for cyclicality, not a gift; memory is the tightest bottleneck (market ~10x from 2023 trough toward ~$889B in 2026) with pricing power independent of model-layer ROI (I/O Fund) | Hold core, size for 40%+ drawdown tolerance; prefer memory/foundry (TSMC, SK Hynix, Micron) over merchant GPU beta at this stage; trim on upward capex revisions, add on guidance cuts |
| Hyperscalers (MSFT, GOOGL, AMZN, META) | ROIC dilution, not solvency risk; EPS quality deteriorates as depreciation compresses; FCF trough is 2026–27 with consensus recovery 2028 — the recovery is the risk (Apollo/Yahoo) | Accumulate on FCF-trough pessimism for 3–5y horizons; demand evidence of AI revenue > depreciation (already crossed) then > full capital charge; prefer the names with identifiable AI revenue (MSFT $37B run rate) over pure spend stories |
| Foundation labs (OpenAI, Anthropic) | Revenue hypergrowth vs. funding-chain dependence; Anthropic's ~$65B ARR with first profitable quarter is the strongest proof point; OpenAI's flat $852B August tender despite doubling ARR is a negative signal from sophisticated insiders (ValueAdd VC) | Private: prefer Anthropic at ~15x ARR over OpenAI at ~21x; treat pre-IPO allocations as venture risk (size accordingly); public: watch Anthropic IPO (filed June 2026, targeted October) as the sector's price-discovery event |
| Neoclouds (CRWV et al.) | Weakest link: levered, single-theme, collateral depreciating faster than debt amortizes; CDS at ~700bp is the market's verdict; the equity is effectively an option on refinancing | Avoid/short equity; the trade with better asymmetry is CDS or put structures on the weakest structures rather than the well-collateralized IG tranches |
| Oracle / lab-concentrated credit | No counterparty passthrough on the $300B OpenAI book; BBB- with negative FCF; the one hyperscaler-adjacent name where "low ROI" can become a credit event | Underweight equity; credit offers carry but requires conviction on OpenAI's funding chain through 2029 |
| Power, cooling, grid, networking | The power constraint is the moat: sold-out energized capacity, multi-year backlogs, contracted revenue; beneficiaries regardless of which model wins; watch gas turbines, transformers, Vertiv/Eaton-class names | Overweight for 3–5y; this is the "picks and shovels" layer least exposed to token-price deflation |
| AI application/software | Deflation's beneficiary; 5–8% ROI cohort expanding; agentic deployments showing 171%+ average reported returns vs. 95% pilot failure for unscoped GenAI (ValueAdd VC) | Overweight vertical, workflow-integrated AI vendors and the enterprises monetizing (Klarna-style cost takeout); this is where the surplus pools if the base case plays out |
| Legacy SaaS | Second-order victim: agentic substitution is already driving a sector de-rating | Underweight seat-based pricing models; the AI bust scenario ironically relieves pressure here — correlation note for hedging |
6.2 By Horizon and Instrument6.2 按期限与工具划分
Trading horizon (6–18 months): the cycle now turns on guidance, not narratives. The high-signal dashboard: (1) hyperscaler capex guidance revisions at Q3/Q4 earnings — a single downward revision validates the bear path and reprices the whole chain; (2) the SemiAnalysis H100 rental index — a break back below ~$1.70 signals oversupply is overwhelming the power gate; (3) CoreWeave CDS — compression toward 400bp means refinancing viability, widening past 800bp signals distress acceleration; (4) the Anthropic IPO print and aftermarket — the first real mark on frontier-lab equity; (5) hyperscaler FCF vs. consensus 2028 recovery curve (AI Realist). September 2026's rotation (out of capex-chain hardware, into monetizers) is the template trade; with Fed hike odds at ~85% and the 10-year near 5%, duration pressure compounds the de-rating risk for long-duration AI names (Yahoo Finance).
3–5 year hold: the base case (45%) argues for owning the theme but restructuring how. A barbell: profitable monetizers with real AI revenue (Microsoft, Alphabet — bought on FCF-trough pessimism, since the trough is a known-known) on one side; power/cooling/grid and memory with contracted backlog on the other. Underweight the depreciation-schedule holders on borrowed money (neocloud equity, Oracle equity) and the pure spend-without-revenue stories. For private markets: the circularity means LP exposure to AI is likely already higher than reported holdings suggest (venture funds holding OpenAI/Anthropic marks, private credit holding GPU-backed paper, infra funds holding data-center SPVs) — a look-through exercise is warranted before adding. Secondaries in 2018–2021 vintage VC funds with large OpenAI/Anthropic marks may offer discounted entry with the mark-to-market risk already partially absorbed; conversely, late-stage primary rounds at flat-to-down marks (the August OpenAI tender at $852B flat) signal where the marginal private buyer's conviction actually sits.
Sizing logic: with the bear tail at ~30% and the base case itself implying multiple compression, AI-infrastructure beta should be sized as a cyclical, not a secular compounder: core positions sized to survive a 40–50% drawdown without forced selling; the "low ROI" thesis itself is best expressed not as a broad AI short (revenue growth makes that expensive) but as relative-value: long monetizers/power, short depreciation-chain equity (neoclouds, lab-concentrated credit proxies), or long hyperscaler credit (defensive carry on the same theme, per J.P. Morgan's framing that bondholders need cash flow stability, not ROI) vs. long-duration AI equity (J.P. Morgan AM). For family offices specifically: the correlated nature of public AI equity, venture marks, and private credit AI exposure means the effective portfolio beta to a capex-cycle break is almost certainly higher than any single sleeve suggests.
6.3 What Would Change Our View6.3 哪些因素会改变我们的观点
Upgrade toward bull (probability shift >35%): enterprise ROI-realization rates moving from 5–8% toward 15%+ in 2027 surveys; hyperscaler FCF troughing earlier than the 2028 consensus; AI revenue sustaining >80% growth into 2027 against a flattening capex curve (the gap closing from both sides); GPU residual values stabilizing across a full generational transition (H100→B200→Rubin) without a resale-market break.
Downgrade toward bear (>40%): any hyperscaler 2027 capex guide below 2026 actuals; OpenAI or Anthropic raising at a down mark or delaying IPOs; a neocloud restructuring that forces GPU liquidation into the resale market; CoreWeave CDS sustained >800bp; AI revenue growth decelerating below ~40% while the depreciation wall (~$485B/yr by 2028 on our model) is still rising.
7. Bottom Line7. 结论
The user's four-pillar thesis is, on the evidence of September 2026, one of the better-constructed bear frameworks available — it correctly identifies the revenue-gap arithmetic (validated by Cahn, Bain, and our own depreciation model), the accounting softness in useful-life assumptions (validated by the Amazon/Meta divergence and Burry's quantification), the overbuild mechanism (validated by the financing regime shift and credit-market pricing), and the deflationary dynamics at the model layer. Where we part company is the strong-form conclusion. "Low ROI on the marginal dollar" — yes, ~65–70% probability, and arguably already the market's base case given Nvidia's multi-year-low multiple. "An overbuild bust that destroys the asset value" — only ~30%, because three things are genuinely different from 2000: the power constraint gates usable supply, the core assets generate revenue from day one (the depreciation crossover already happened in Q1 2026), and the central players are among the most profitable companies in history rather than cash-burning carriers.
The right posture for an institutional allocator is therefore not wholesale avoidance but selective underwriting of who holds which risk: own cash flows that survive a capex plateau (power, grid, memory, monetizers with demonstrated AI revenue), avoid or short the capital structures that require the boom to continue (neocloud equity, lab-concentrated credit, pre-IPO lab equity at full marks), and treat the next four quarters of guidance, FCF prints, and the Anthropic IPO as the highest-information window of the cycle. The scenario the market is least prepared for is not the bust — it is being talked about constantly — it is the muddle-through: two to three years of flattish returns, negative FCF, and rising depreciation at the index's largest weights, which quietly compresses returns for every passive portfolio on earth.
This report is for general informational purposes only and does not constitute investment advice, an offer, or a solicitation. Figures cited from third-party sources are as reported by those sources on the dates indicated; scenario probabilities are subjective estimates. Data as of September 16, 2026.